The Final Mile: Deployment Monitoring and Business Impact
We’ve come a long way. From a simple local prototype to a massively parallel cloud system, we’ve built a formidable demand forecasting engine. But here’s the hard truth: a model that isn’t driving business decisions is just an expensive science project.
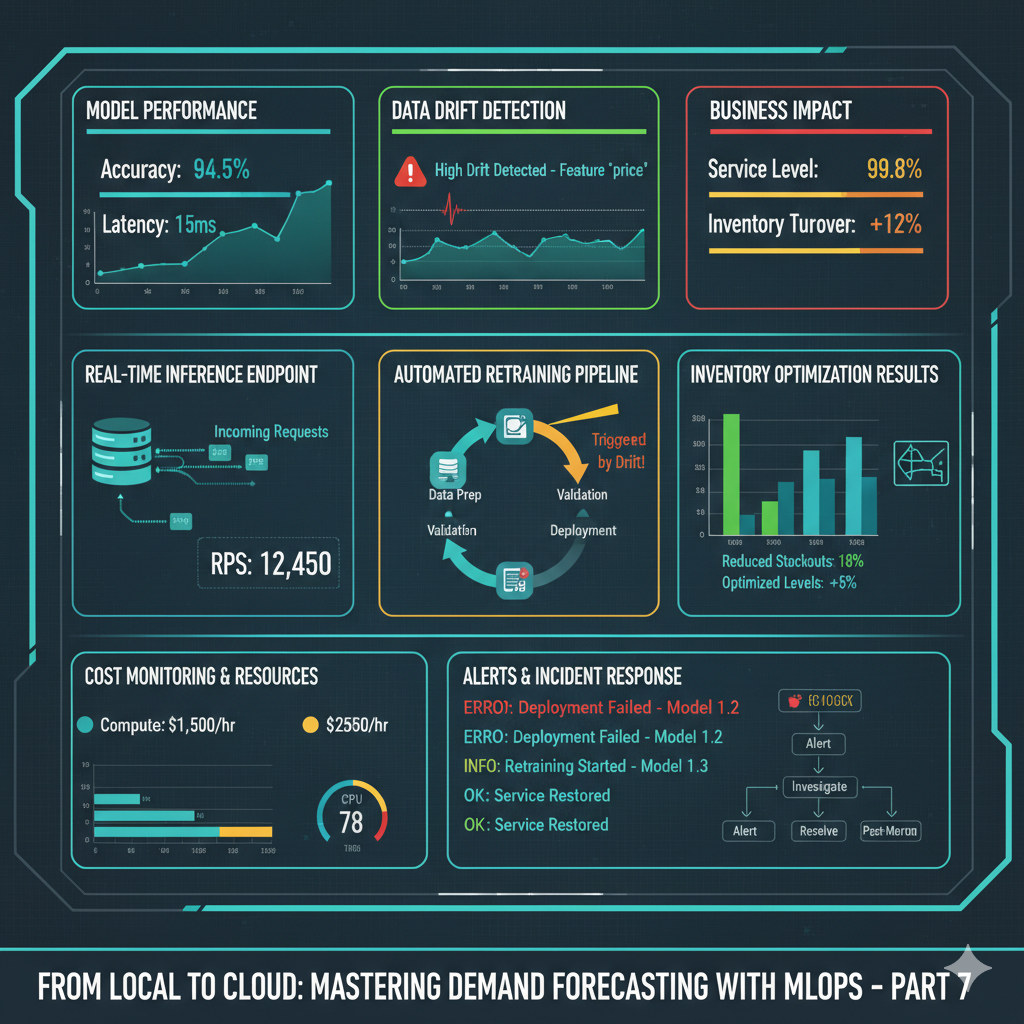
In this final article, we complete our journey by focusing on what happens after the training jobs finish. We’ll deploy our models for real-time inference, implement comprehensive monitoring, and—most importantly—connect our forecasts to tangible business outcomes.
You can find all code here time series.
Closing the Loop: From Predictions to Actions
Our forecasting system must integrate seamlessly with business operations:
[Real-time Demand] → [Model Inference] → [Inventory System]
        ↓
[Purchase Orders] → [Warehouse Operations] → [98% Service Level]
Step 1: Real-time Inference Endpoints
Let’s deploy our models for both real-time and batch predictions:
src/cloud/inference.py
class ForecastingEndpoint:
    """Manage real-time inference endpoints"""

    def __init__(self, endpoint_name: str, s3_bucket: str):
        self.sagemaker_runtime = boto3.client('sagemaker-runtime')
        self.sagemaker = boto3.client('sagemaker')
        self.endpoint_name = endpoint_name
        self.s3_bucket = s3_bucket

    def create_endpoint(self, model_name: str, instance_type: str = 'ml.m5.large'):
        """Create a real-time inference endpoint"""
        ...
        # Create endpoint
        try:
            self.sagemaker.create_endpoint(
                EndpointName=self.endpoint_name,
                EndpointConfigName=endpoint_config_name
            )
        ...
    def predict_single(self, product_id: str, features: Dict[str, Any]) -> float:
        ...
        try:
            response = self.sagemaker_runtime.invoke_endpoint(
                EndpointName=self.endpoint_name,
                ContentType='application/json',
                Body=json.dumps(payload)
            )
        ...
    def batch_predict(self, product_ids: List[str], prediction_date: str) -> pd.DataFrame:
        ...
    ...
# Real-time inference handler
def lambda_inference_handler(event, context):
    endpoint = ForecastingEndpoint('demand-forecast-endpoint', 'your-bucket')
    ...
    # Make prediction
    prediction = endpoint.predict_single(product_id, features)
Step 2: Model Monitoring and Drift Detection
Models decay over time. Let’s implement comprehensive monitoring:
src/cloud/monitoring.py
class ModelMonitor:
    """Monitor model performance and data drift"""

    def __init__(self, s3_bucket: str):
        self.s3 = boto3.client('s3')
        self.cloudwatch = boto3.client('cloudwatch')
        self.s3_bucket = s3_bucket

    def calculate_model_metrics(self, y_true: List[float], y_pred: List[float]) -> Dict[str, float]:
        """Calculate model performance metrics"""

        mae = np.mean(np.abs(np.array(y_true) - np.array(y_pred)))
        mape = np.mean(np.abs((np.array(y_true) - np.array(y_pred)) / np.array(y_true))) * 100
        rmse = np.sqrt(np.mean((np.array(y_true) - np.array(y_pred)) ** 2))
        ...
    def detect_data_drift(self, current_data: pd.DataFrame, reference_data: pd.DataFrame) -> Dict[str, Any]:
        ...
        # KS test for distribution change
        from scipy import stats
        statistic, p_value = stats.ks_2samp(
            reference_data[col].dropna(),
            current_data[col].dropna()
        )
        ...
    def check_concept_drift(self, product_id: str, lookback_days: int = 30) -> Dict[str, Any]:
        ...
    def publish_metrics_to_cloudwatch(self, metrics: Dict[str, float], product_id: str):
        ...
        metric_data.append({
            'MetricName': metric_name,
            'Dimensions': [
                {'Name': 'ProductId', 'Value': product_id},
                {'Name': 'ModelType', 'Value': 'DemandForecast'}
            ],
            'Value': value,
            'Unit': 'Count',
            'Timestamp': timestamp
        })
        ...
    def create_alerts(self, product_id: str):
        ...
        self.cloudwatch.put_metric_alarm(
            AlarmName=alarm_name,
            AlarmDescription=f'Data drift detected for {product_id}',
            MetricName='mape',
            Namespace='DemandForecast',
            Statistic='Average',
            Dimensions=[
                {'Name': 'ProductId', 'Value': product_id},
                {'Name': 'ModelType', 'Value': 'DemandForecast'}
            ],
            Period=300,  # 5 minutes
            EvaluationPeriods=2,
            Threshold=15.0,  # MAPE threshold
            ComparisonOperator='GreaterThanThreshold',
            AlarmActions=[
                'arn:aws:sns:us-east-1:123456789012:model-drift-alerts'  # Your SNS topic
            ]
        )

# Scheduled monitoring function
def scheduled_monitoring_handler(event, context):
    ...
    # Check for concept drift
    drift_status = monitor.check_concept_drift(product_id)

    if drift_status.get('status') == 'degraded':
        alerts.append({
            'product_id': product_id,
            'issue': 'concept_drift',
            'metrics': drift_status.get('metrics', {}),
            'timestamp': datetime.now().isoformat()
        })

    # Publish metrics for alerting
    monitor.publish_metrics_to_cloudwatch(
        drift_status['metrics'],
        product_id
    )
    ...
Step 3: Business Impact Dashboard
Let’s connect our forecasts to business outcomes:
src/cloud/business_dashboard.py
class BusinessDashboard:
    """Dashboard showing business impact of forecasts"""

    def __init__(self, s3_bucket: str):
        self.s3_bucket = s3_bucket

    def calculate_service_level(self, actual_demand: List[float], inventory: List[float]) -> float:
        ...
    def calculate_inventory_turnover(self, sales: List[float], avg_inventory: List[float]) -> float:
        ...
    def calculate_cost_savings(self, current_stockouts: int, improved_stockouts: int,
                               avg_order_value: float) -> float:
        ...
    def generate_performance_report(self, product_id: str, start_date: str, end_date: str) -> Dict[str, Any]:
        ...
        data = s3_mgr.download_dataframe(f"processed/{product_id}.parquet")
        data = data[(data['date'] >= start_date) & (data['date'] <= end_date)]

        # Simulate inventory decisions based on forecasts
        # In reality, this would come from your inventory system
        data['inventory_level'] = data['predicted_demand'] * 1.1  # 10% buffer
        data['stockout'] = data['units_sold'] > data['inventory_level']

        # Calculate key metrics
        service_level = self.calculate_service_level(
            data['units_sold'].tolist(),
            data['inventory_level'].tolist()
        )

        inventory_turnover = self.calculate_inventory_turnover(
            data['units_sold'].tolist(),
            data['inventory_level'].tolist()
        )

        total_stockouts = data['stockout'].sum()
        potential_revenue_lost = total_stockouts * data['selling_price'].mean()
        ...
    def create_dashboard_visualization(self, report_data: Dict[str, Any]):
        ...
# API endpoint for business dashboard
def dashboard_api_handler(event, context):
    dashboard = BusinessDashboard('your-bucket')

    product_id = event.get('queryStringParameters', {}).get('product_id', 'P003')
    start_date = event.get('queryStringParameters', {}).get('start_date', '2023-01-01')
    end_date = event.get('queryStringParameters', {}).get('end_date', '2023-12-31')
    ...
    report = dashboard.generate_performance_report(product_id, start_date, end_date)
    ...
    # Generate visualization
    fig = dashboard.create_dashboard_visualization(report)
    ...
Step 4: Cost Monitoring and Optimization
Let’s ensure our system is cost-effective:
src/cloud/cost_optimization.py
class CostOptimizer:
    """Monitor and optimize cloud costs"""

    def __init__(self):
        self.cloudwatch = boto3.client('cloudwatch')
        self.ce = boto3.client('ce')  # Cost Explorer

    def get_ml_costs(self, start_date: str, end_date: str) -> Dict[str, float]:
        """Get ML-related costs from Cost Explorer"""

        response = self.ce.get_cost_and_usage(
            TimePeriod={
                'Start': start_date,
                'End': end_date
            },
            Granularity='DAILY',
            Metrics=['UnblendedCost'],
            Filter={
                'Dimensions': {
                    'Key': 'SERVICE',
                    'Values': ['Amazon SageMaker', 'AWS Lambda', 'Amazon S3']
                }
            }
        )

        total_cost = 0.0
        daily_costs = {}

        for day in response['ResultsByTime']:
            cost = float(day['Total']['UnblendedCost']['Amount'])
            total_cost += cost
            daily_costs[day['TimePeriod']['Start']] = cost

        return {
            'total_cost': total_cost,
            'daily_costs': daily_costs,
            'average_daily_cost': total_cost / len(daily_costs) if daily_costs else 0
        }

    def calculate_roi(self, business_savings: float, ml_costs: float) -> Dict[str, float]:
        """Calculate ROI of the forecasting system"""

        roi = (business_savings - ml_costs) / ml_costs * 100
        payback_period = ml_costs / (business_savings / 30)  # Months to payback

        return {
            'roi_percentage': roi,
            'payback_period_months': payback_period,
            'net_savings': business_savings - ml_costs,
            'cost_benefit_ratio': business_savings / ml_costs
        }

    def optimize_resources(self, usage_metrics: Dict[str, float]):
        """Suggest resource optimization based on usage"""

        recommendations = []

        # SageMaker instance optimization
        if usage_metrics.get('inference_cpu_utilization', 0) < 30:
            recommendations.append({
                'service': 'SageMaker',
                'recommendation': 'Downsize inference instances',
                'estimated_savings': '40%',
                'risk': 'Low'
            })

        # S3 storage optimization
        if usage_metrics.get('old_model_storage_gb', 0) > 100:
            recommendations.append({
                'service': 'S3',
                'recommendation': 'Implement lifecycle policies for old models',
                'estimated_savings': '60%',
                'risk': 'Low'
            })

        return recommendations


# Cost monitoring function
def cost_monitoring_handler(event, context):
    """Regular cost monitoring and optimization"""

    optimizer = CostOptimizer()

    # Get costs for last 30 days
    end_date = datetime.now().strftime('%Y-%m-%d')
    start_date = (datetime.now() - timedelta(days=30)).strftime('%Y-%m-%d')

    costs = optimizer.get_ml_costs(start_date, end_date)

    # Calculate ROI (using estimated business savings)
    # In reality, this would come from your business metrics
    estimated_savings = 50000  # Estimated from reduced stockouts
    roi_analysis = optimizer.calculate_roi(estimated_savings, costs['total_cost'])

    # Generate optimization recommendations
    recommendations = optimizer.optimize_resources({
        'inference_cpu_utilization': 25,  # Would come from CloudWatch
        'old_model_storage_gb': 150  # Would come from S3 inventory
    })

    return {
        'costs': costs,
        'roi_analysis': roi_analysis,
        'recommendations': recommendations
    }
The Journey Complete
We started with a business problem and ended with a business solution. Here’s what we’ve accomplished:
- ✅ Problem Understanding: Connected forecasting accuracy to business outcomes
- ✅ Technical Foundation: Built statistically sound models with proper validation
- ✅ ML Enhancement: Incorporated business context through feature engineering
- ✅ MLOps Structure: Created reproducible, maintainable codebase
- ✅ Cloud Scale: Transformed to massively parallel processing
- ✅ Production Deployment: Implemented real-time inference and monitoring
- ✅ Business Integration: Connected forecasts to inventory decisions and ROI
The Real Measure of Success
Our success isn’t measured in model accuracy or pipeline efficiency alone. It’s measured in:
- 98% service levels achieved
- Reduced stockouts and lost sales
- Optimized inventory carrying costs
- Business teams making data-driven decisions
Continuing the Journey
While our series concludes here, the MLOps journey never truly ends. Next steps would include:
- A/B testing new model architectures
- Implementing feature stores for consistency
- Expanding to new product categories and regions
- Integrating with supply chain partners
From Concept to Competitive Advantage
We’ve transformed demand forecasting from an academic exercise into a core business capability. The system we built doesn’t just predict the future—it actively shapes it by enabling better business decisions.
The code, the infrastructure, the monitoring—all of it serves one purpose: helping the business win.
Series Complete! Thank you for following along on this journey from local prototype to cloud-scale business solution.