The Gold Standard: How AB Tests Work and When You Can't Use Them
In my first article Beyond Correlation: Why Your Business Metrics Are Lying to You, we talked about how correlation lies and how that costs businesses millions. So what’s the solution? How do we definitively learn what causes what?
For data-driven organizations, the answer is often the A/B test (also known as a Randomized Controlled Trial or RCT). It’s the gold standard for a reason.
But what if I told you that for many of the most critical business questions—especially in finance—running a proper A/B test is either impossible, unethical, or hopelessly impractical?
Today, we’ll break down why A/B tests are so powerful and then expose their Achilles’ heel in the real world.
Why A/B Tests Are a Data Scientist’s Superpower
An A/B test is deceptively simple. You want to know if a new website button (Treatment A) is better than the old one (Treatment B). So, you randomly assign your website visitors to see either A or B. You then compare the click-through rates.
The magic isn’t in the random assignment itself; it’s in what random assignment guarantees.
Using the Potential Outcomes Framework from previous article, random assignment creates two groups that are, on average, identical in every way possible:
- Observed factors (age, location, past behavior)
- Unobserved factors (mood, time of day, brand loyalty)
Because the groups are identical at the start of the experiment, any difference in the outcome at the end can be attributed to one thing and one thing only: the treatment (Button A vs. B).
This allows you to calculate the Average Treatment Effect (ATE) with high confidence:
ATE = (Result of Group A) - (Result of Group B)
No guessing. No confounding variables. Just clean, causal evidence.
The Real World Intrudes: When the Gold Standard Fails
We all love a good A/B test. But let’s be honest: how often have you been in a planning meeting where someone says, “We can’t A/B test that”?
This isn’t an exception; it’s the rule for many high-impact decisions. Let’s use our in-store flyer example from my first article to explore why.
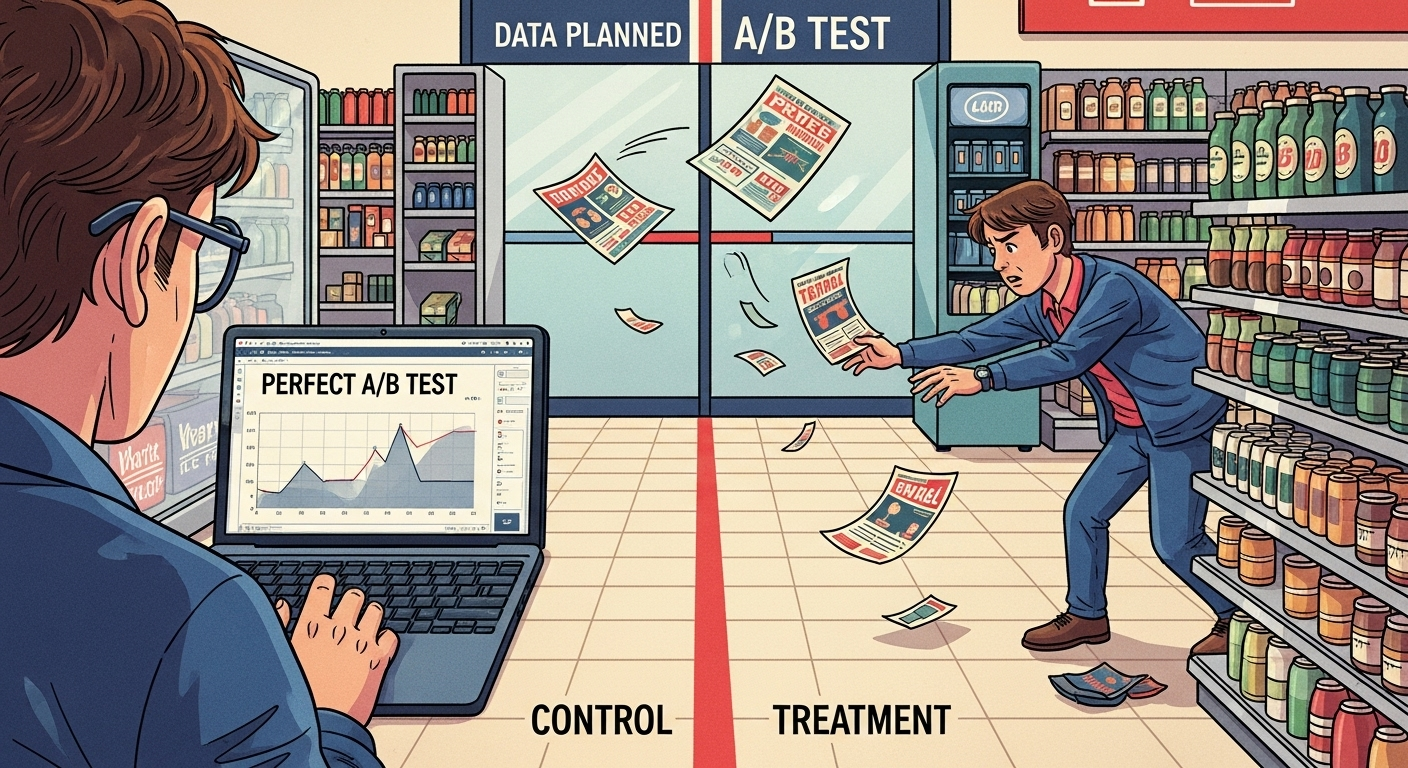
1. Physical World Contamination (The Spillover Effect)
- Problem: You can’t randomize individuals within a single store. If you put a flyer on one counter and not another, customers will see both. A customer in the “control group” might see a flyer on someone else’s counter or be influenced by someone who did.
- Result: The treatment “leaks” into the control group, contaminating your results and understating the true effect. Your experiment is ruined.
2. The Unit of Diversion Problem
- Problem: For a physical campaign, the smallest unit you can randomize isn’t a person; it’s often a store, a region, or a DMA. This is a “geo-based” or “cluster-based” test. This requires many more units (dozens of stores, not dozens of people) to achieve the same statistical power, making it expensive and complex.
3. Ethical & Customer Experience Concerns
- Problem: Could withholding the offer from a random group of customers hurt them or create a negative brand experience? For example, randomly denying some customers a chance to apply for a credit card could be seen as unfair or even discriminatory if not handled with extreme care.
4. Implementation Cost & Overhead
- Problem: Designing, executing, and monitoring a perfectly controlled geo-based RCT is a significant operational project. It requires coordination across marketing, analytics, and field operations. For a one-off flyer campaign, the cost of the experiment might exceed the cost of the campaign itself.
5. Measuring Long-Term Outcomes
- Problem: A/B tests are great for short-term metrics ( clicks, applications). But our real goal was to measure long-term churn. Keeping track of which group a customer was in over 12+ months and ensuring no other factors interfere is a monumental challenge.
So Are We Just Stuck?
If the perfect tool is often out of reach, does that mean we’re doomed to make decisions based on flawed correlations?
Absolutely not.
The inability to run an experiment doesn’t mean we abandon the quest for causal truth. It means we have to get more creative with our data. We have to learn how to conduct observational studies that mimic randomized experiments.
This is where powerful methods like Propensity Score Matching, Difference-in-Differences, and Instrumental Variables come into play. These techniques allow us to draw causal inferences from the messy, non-randomized data we already have.
In the next article, we’ll dive into the first and most popular of these methods: Propensity Score Matching. I’ll show you how we can use it to solve the in-store flyer problem and finally get a truthful answer about its impact on customer churn.