Beyond Correlation: Why Your Business Metrics Are Lying to You
You’ve seen it before. The presentation slide that says: “Our new social media campaign launched in Q3, and customer acquisitions increased by 15%. The campaign was a success!”
The room nods in agreement. The marketing team gets a pat on the back. The budget for similar campaigns is increased.
But a question gnaws at you: Did the campaign actually cause the increase, or did we just spend a million dollars on credit for something that was going to happen anyway?
This isn’t an academic question. It’s the difference between data-driven decision-making and strategic guessing. And in the world of finance, where customer lifetime value is king and acquisition budgets are huge, guessing wrong is incredibly expensive.
The Siren Song of Correlation
Humans are wired to see patterns. In data science and business analytics, we often formalize this as correlation. We see two metrics move together—campaign spend and acquisitions—and we instinctively infer a cause-and-effect relationship.
This is the trap. Correlation is just a observation; it is not an explanation.
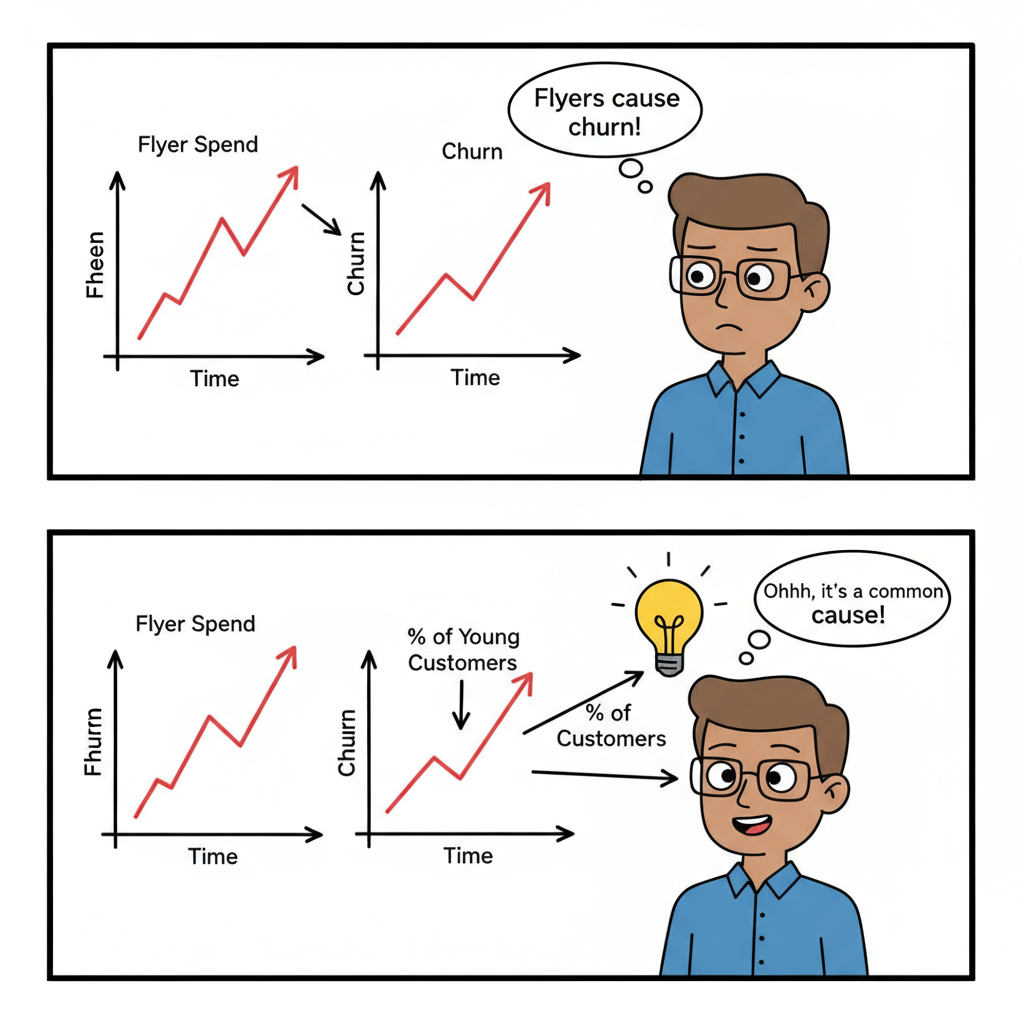
Let’s take a real example from financial services. Imagine you place display flyers for a new credit card in convenience stores. You track applications using a promo code and see a solid number of new customers. A few months later, you also notice that the churn rate among these customers seems higher than average.
- Correlation: The flyer campaign is correlated with higher churn.
- Naive Conclusion: “This campaign attracts low-quality, disloyal customers. We should cancel it.”
But what if you’re wrong? What if the flyers are simply effective at reaching a demographic that is naturally more likely to churn? (e.g., younger, more price-sensitive customers). The campaign isn’t causing the churn; it’s just doing its job of finding new customers in a pool where churn is high. If you cancel it, you might be cutting off a valuable acquisition channel based on a flawed analysis.
The campaign itself is innocent. The error is in the measurement.
The Multi-Million Dollar Cost of Getting It Wrong
Misattributing cause and effect has a direct and severe impact on the bottom line. This isn’t just a statistical error; it’s a business risk.
- Wasting Budget: You double down on campaigns that look successful but aren’t actually driving incremental growth. You’re pouring money into a leaky bucket. Conversely, you might kill a truly effective campaign based on a flawed correlation.
- Misallocating Resources: Your team spends time optimizing the wrong things—tweaking a flyer design that doesn’t matter, instead of addressing the real reason for churn.
- Making Poor Strategic Decisions: Leadership sets strategy based on incorrect performance data. You might abandon an entire market segment or product line based on a misunderstanding of what drives its performance.
The Root of the Problem: The Counterfactual
The reason this is so hard is that we can never run the perfect experiment. We can’t go back in time and see what would have happened to the same group of customers if we had not run the flyer campaign. This unobservable reality is called the counterfactual.
This is the fundamental problem of causal inference, and it’s why your dashboard metrics, while useful for description, are often liars for prescription.
So How Do We Find the Truth? We Mimic Reality
We may not have time machines, but we do have robust statistical frameworks to estimate that counterfactual. This is the field of causal inference.
Instead of just comparing the churn rate of the flyer group to everyone else (a flawed comparison), we use methods like Propensity Score Matching to find a “control group” that is a twin of our treatment group. We find customers acquired through other channels who are identical in age, credit score, location, and other factors. Then we compare churn rates.
This allows us to say, with much greater confidence: “After controlling for all other factors, the flyer campaign itself caused a X% increase/decrease in churn.”
That is a powerful, actionable, and truthful insight.
Stop Guessing, Start Knowing
In the high-stakes world of finance, we can’t afford to be wrong about what drives our business. Moving beyond correlation to causation isn’t a statistical nicety—it’s a competitive necessity.
In the next article, we’ll break down the gold standard for finding causation: A/B testing. We’ll explore why it’s not always possible (especially with physical campaigns like our flyer example) and how that sets the stage for the powerful observational techniques we’ll cover later in this series.